Improvements in Diagnostic Test Results Associated with the Adoption of the Science Bits Program
A new study suggests that the Science Bits program helps improve diagnostic test results in Science for ESO students (Middle School students, 12 -16 years old). Schools that adopted Science Bits from 2019 to 2023 have shown more significant progress in their students’ scientific skills.
27 de mayo de 2024
- The study compares the progress of 22 schools that adopted Science Bits in 2019 (experimental group) with 22 schools that did not (control group), based on the diagnostic tests for 10th grade from 2019 to 2023.
- Both groups of schools started with the same Science results in 2019 and include the same proportion of public and private schools, as well as a similar number of students.
- The schools in the experimental group experienced greater improvement in Science than the control group, while both groups showed the same changes in Mathematics, Catalan, Spanish, and English.
- If we rank the schools based on their Science results, both groups started from a very similar average position in 2019 (530 vs. 535). But in 2023, the experimental group moved up 35 positions, while the control group dropped more than 60 positions.
- Replicating the study with 22 more schools that adopted Science Bits in 2018 yields the same results.
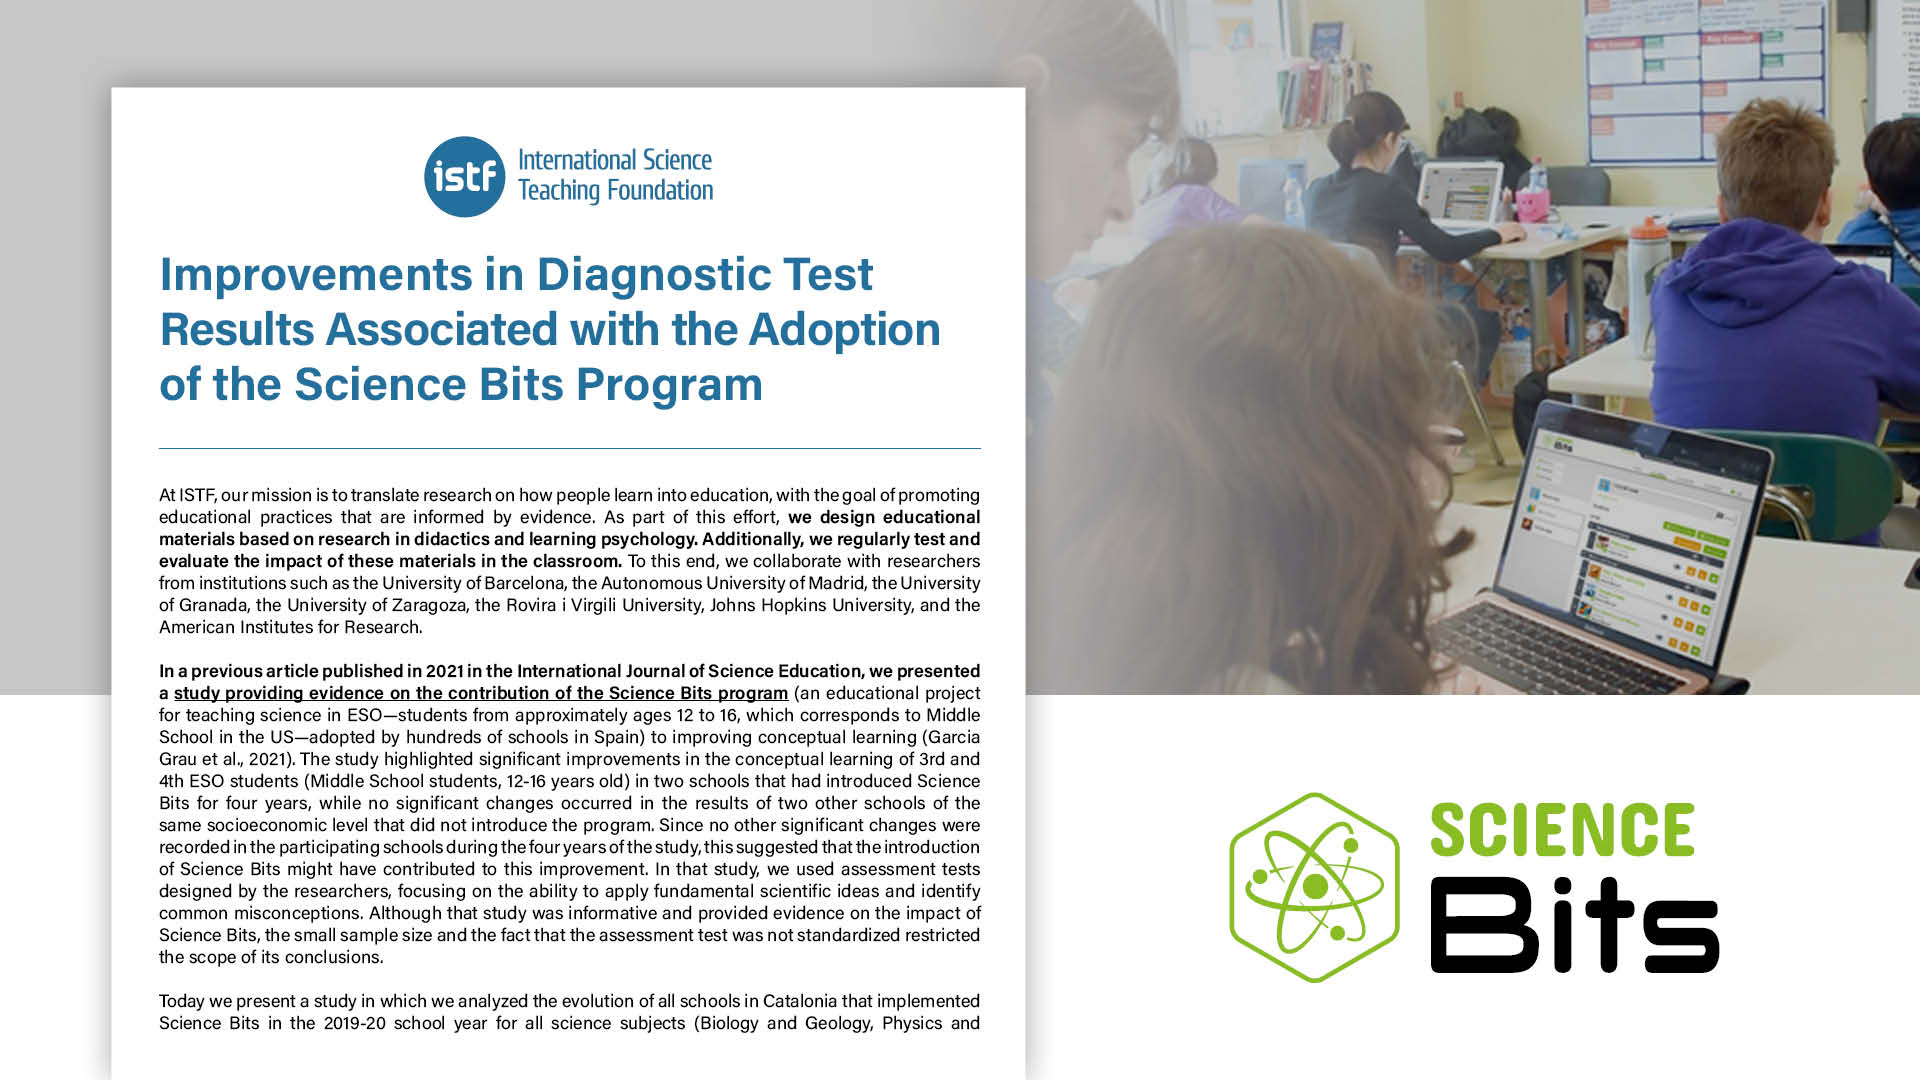
At ISTF, our mission is to translate research on how people learn into education, with the goal of promoting educational practices that are informed by evidence. As part of this effort, we design educational materials based on research in didactics and learning psychology. Additionally, we regularly test and evaluate the impact of these materials in the classroom. To this end, we collaborate with researchers from institutions such as the University of Barcelona, the Autonomous University of Madrid, the University of Granada, the University of Zaragoza, the Rovira i Virgili University, Johns Hopkins University, and the American Institutes for Research.
In a previous article published in 2021 in the International Journal of Science Education, we presented a study providing evidence on the contribution of the Science Bits program (an educational project for teaching science in ESO—students from approximately ages 12 to 16, which corresponds to Middle School in the US—adopted by hundreds of schools in Spain) to improving conceptual learning (Garcia Grau et al., 2021). The study highlighted significant improvements in the conceptual learning of 3rd and 4th ESO students (Middle School students, 12-16 years old) in two schools that had introduced Science Bits for four years, while no significant changes occurred in the results of two other schools of the same socioeconomic level that did not introduce the program. Since no other significant changes were recorded in the participating schools during the four years of the study, this suggested that the introduction of Science Bits might have contributed to this improvement. In that study, we used assessment tests designed by the researchers, focusing on the ability to apply fundamental scientific ideas and identify common misconceptions. Although that study was informative and provided evidence on the impact of Science Bits, the small sample size and the fact that the assessment test was not standardized restricted the scope of its conclusions.
An Analysis Based on the Official Diagnostic Test Results
Today we present a study in which we analyzed the evolution of all schools in Catalonia that implemented Science Bits in the 2019-20 school year for all science subjects (Biology and Geology, Physics and Chemistry) across all ESO grades, and have continued using the program in these grades up to the present. We compared this to the evolution of a random sample of an equivalent number of schools that have never used Science Bits. This time, we compared the results obtained in the official diagnostic tests (competency tests) administered annually by the Department of Education of the Generalitat of Catalonia to 4th ESO students, specifically the results from 2019 and 2023. We specifically selected the schools that incorporated Science Bits in the 2019-20 school year to observe the differences in the results between students who had never used Science Bits (and took the diagnostic tests in April 2019) and students who used it throughout all four years of ESO (and took the diagnostic tests in April 2023). Using the results of the official diagnostic tests provides an external measure to the researchers, making the analysis of the program’s impact on learning more objective.
In total, 22 schools met the condition regarding the use of Science Bits (experimental group). Next, we randomly selected another 22 schools that have never used the program to establish a control group and proceeded to a comparative analysis of their diagnostic test results. The characteristics of both groups are detailed in the following table (Table 1):
| Experimental Group | Control Group |
| Number of schools: 22 | Number of schools: 22 |
| Public schools: 12 | Public schools: 10 |
| Underserved schools: 0 | Underserved schools 0 |
| Total 4th ESO students in 2019*: 1390 | Total 4th ESO students in 2019*: 1378 |
| Total 4th ESO students in 2023*: 1604 | Total 4th ESO students in 2023*: 1384 |
* We include the number of students to show that the size of the schools in each group is similar. However, the analysis is not conducted individually for each student but based on the average evaluation results of each school.
First, we verified the randomness of the sample by performing a z-test, which confirmed that both the experimental (SB) and control (NO-SB) groups can be considered random samples of the population formed by all schools in Catalonia, regarding the 2019 Science diagnostic tests. Indeed, an independent samples t-test confirmed that there are no statistically significant differences between the results of both groups in these tests, meaning they started from identical results in 2019.
The average scores of each group in the diagnostic test results in 2019 and 2023 are as follows:
| Subject | 2019 | 2023 | Difference | |||
| NO-SB | SB | NO-SB | SB | NO-SB | SB | |
| Science | 66.73 | 67.17 | 68.06 | 70.78 | 1.33 | 3.65 |
| Mathematics | 68.36 | 69.80 | 64.75 | 66.10 | −3.61 | −3.70 |
| Catalan | 77.54 | 79.34 | 73.59 | 74.68 | −3.95 | −4.65 |
| Spanish | 79.41 | 79.60 | 73.30 | 73.51 | −6.11 | −6.09 |
| English | 74.53 | 76.25 | 74.79 | 75.99 | 0.25 | −0.26 |
Next, we performed a paired samples t-test to compare the results of each school in 2019 and 2023 and find out if there were significant differences. The results are shown below (Table 3):
| Measurement 2023 vs 2019 | t | diff | p* | Cohen’s d** |
| Science SB | 4.488 | 21 | 2.021e-4 | 0.957 |
| Science NO-SB | 1.597 | 21 | 0.125 | 0.341 |
| Mathematics SB | −3.246 | 21 | 0.004 | −0.692 |
| Mathematics NO-SB | −4.785 | 21 | 9.981e-5 | −1.020 |
| Catalan SB | −4.542 | 21 | 1.778e-4 | −0.968 |
| Catalan NO-SB | −5.892 | 21 | 7.547e-6 | −1.256 |
| Spanish SB | −6.474 | 21 | 2.048e-6 | −1.380 |
| Spanish NO-SB | −9.005 | 21 | 1.175e-8 | −1.920 |
| English SB | −0.233 | 21 | 0.818 | −0.050 |
| English NO-SB | 0.278 | 21 | 0.784 | 0.059 |
*A p-value less than 0.05 means that the difference in results between 2019 and 2023 is statistically significant.
**Cohen’s d indicates the size of the difference in terms of standard deviations. If positive, it indicates an improvement between 2019 and 2023; if negative, a decline.
Note: a normality test (Shapiro-Wilk) confirms that all samples follow a normal distribution, which allows the t-test to be applied with confidence.


The Results Continue Supporting the Effectiveness of Science Bits
The data reveal that experimental schools show an improvement in Science results of 3.61 points, while control schools show an improvement of 1.32 points (Table 2). However, the statistical analysis suggests that only the difference in the experimental group is significant (it would not be explained by chance except in 0.02% of cases), while the difference in the control group is not: it could be due to chance (Table 3). In any case, it would not be surprising if both groups showed differences between 2019 and 2023 (as reflected in the results in other subjects). After all, the differences between the two years could be due to other factors, such as the fact that the diagnostic tests are different and the students as well. However, these differences would be common to both groups of schools, so the threefold greater improvement of the experimental group compared to the control group could not be attributed to these factors, but to a differential factor of the first group compared to the second. Since the only variable distinguishing all schools in the experimental group from those in the control group is the use of the Science Bits program, we can consider that these results suggest that the observed difference is related to the use of these materials.
Indeed, conducting a comparative analysis of results in other subjects provides valuable insights to dismiss the possibility that alternative factors, such as differences in the academic ability of students in 2019 and 2023, are behind the difference in Science results. In this regard, Table 3 shows that the differences in results in other subjects were very similar in both groups, both in languages (with very similar decreases in Catalan and Spanish, and no changes in English) and in Mathematics. Notably, in Mathematics, the difference in results between the two groups was practically the same: a decrease of around 3.6 points between 2019 and 2023. This further emphasizes a differential factor between the control group and the experimental group that would have caused the differences in the evolution of the Science subject specifically.
We can go even deeper into the analysis and statistically assess the differences between the control and experimental groups by applying an independent samples t-test to compare the changes experienced by the schools in their 2019 and 2023 results. The results are shown below:
| t | diff | p* | Cohen’s d** | |
| DIFF Science | −1.975 | 42 | 0.055 | −0.596 |
| DIFF Catalan | 0.066 | 42 | 0.948 | 0.020 |
| DIFF Spanish | 0.574 | 42 | 0.569 | 0.173 |
| DIFF Mathematics | −0.020 | 42 | 0.984 | −0.006 |
| DIFF English | 0.356 | 42 | 0.724 | 0.107 |
*A p-value greater than 0.05 means that the differences in scores obtained by the schools in each group in the diagnostic tests can be considered equivalent.
**Cohen’s d indicates the extent to which the differences in scores for each subject differ between the control and experimental groups (when negative, it indicates that the improvement in the experimental group was greater).
As seen in Table 4, the differences observed in the two groups of schools between 2019 and 2023 can be deemed equivalent in Catalan, Spanish, Mathematics, and English. Regarding Science, the difference is almost statistically significant (based on the criteria we have adopted, where a p-value of less than 0.05 indicates significance). This means that there is a 94.5% probability that the evolution of the experimental group in Science is indeed different (and in this case, superior) to that of the control group. Moreover, the effect size—expressed by Cohen’s d—is clearly relevant, around d=0.596. This means that the difference between 2019 and 2023 achieved by the experimental schools is 0.596 standard deviations greater than that achieved by the control group schools. This difference can be considered very relevant in the field of educational interventions (Funder & Ozer, 2019).
Another very significant finding when comparing the experimental and control groups is the shift in their respective positions in the ranking of all schools based on Science competency test results (Table 5). If we rank all school in Catalonia offering ESO in descending order based on their Science results (with the top-ranking school having the best results), the average position of the experimental group schools in 2019 is 535th, very close to that of the control group, 530th. However, the position of the control group schools drops to 599th in 2023, while the position of the experimental schools rises to 500th.
| 2019 | 2023 | |
| Control group | 530th position | 599th position |
| Experimental group | 535th position | 500th position |
The significant drop in ranking positions for the control group suggests it has fallen behind not only the current experimental group but also other schools that adopted the Science Bits program in previous or subsequent years. To investigate further, we conducted the same analysis on a second experimental group of 22 schools that implemented Science Bits in 2018 and have consistently used it across all grades since then. The characteristics of this group are shown in Table 6.
| Experimental Group 2 (adopted SB in 2018) |
| Number of schools: 22 |
| Public schools: 12 |
| Underserved schools: 0 |
| Total 4th ESO students in 2019*: 1198 |
| Total 4th ESO students in 2023*: 1334 |
Regarding the results of this group in the competency tests of 2019 and 2023, the data is presented in Table 7:
| Subject | 2019 | 2023 | Difference |
| Science | 67.64 | 72.00 | 4.36 |
| Mathematics | 78.96 | 74.55 | −4.41 |
| Catalan | 80.27 | 74.35 | −5.92 |
| Spanish | 69.84 | 66.36 | −3.48 |
| English | 76.71 | 76.24 | −0.47 |
The paired samples t-test comparing the results of these schools between 2019 and 2023 shows results similar to the previous experimental group, with Science scores improving twice as much as the control group, while no significant differences were found in other subjects, confirmed by an independent samples t-test:
| Measurement 2023 vs. 2019 | t | df | *p | **Cohen’s d |
| Science | 2.946 | 21 | 0.008 | 0.628 |
| Catalan | −4.669 | 21 | 1.313e-4 | −0.996 |
| Spanish | −6.566 | 21 | 1.674e-6 | −1.400 |
| Mathematics | −2.550 | 21 | 0.019 | −0.544 |
| English | −0.298 | 21 | 0.768 | −0.064 |
*A p-value less than 0.05 means that the difference in results between 2019 and 2023 is statistically significant.
**Cohen’s d indicates the size of the difference in number of standard deviations. If positive, it indicates an improvement between 2019 and 2023; if negative, a decline.
Note: a normality test (Shapiro-Wilk) confirms that the sample follows a normal distribution, which allows the t-test to be applied with confidence.
Regarding their ranking, the schools in the second experimental group also improved, moving from 480th to 454th, confirming the upward trend of experimental schools and supporting the control group’s decline in positions in favor of the experimental groups.
In conclusion, this analysis provides strong evidence that the Science Bits program helps improve results in the official 4th ESO diagnostic tests. This aligns with previous research in science education, which shows that programs offering well-designed activities to address misconceptions and promote understanding-based learning (and not just explanatory content and exercises), along with effective use of digital media (quality multimedia materials, interactivity, feedback, and information for teachers about student achievement) often outperform conventional educational materials such as traditional textbooks (Cheung et al., 2017; Roblin et al., 2018).
Moreover, the 5E model—the teaching and learning model on which Science Bits is based—has ample evidence of its effectiveness in improving understanding of scientific ideas, reducing misconceptions, achieving academic success, and boosting students’ interest in science (including pursuing science careers), their confidence in learning science, and their attitudes towards science (Bybee et al., 2006; Bybee, 2015). While this analysis primarily examines the program’s impact on competency-based learning, it is also important to evaluate an educational material by how it contributes to promoting interest in science.


References:
- Bybee, R. W.; Taylor, J. A.; Gardner, A.; Van Scotter, P.; Powell, J. C.; Westbrook, A.; & Landas, N. (2006). The BSCS 5E instructional model: Origins and effectiveness. Colorado Springs, Co: BSCS, 5, 88-98.
- Bybee, R. (2015). The BSCS 5E Instructional Model: Creating Teachable Moments. NSTA Press.
- Cheung, A., Slavin, R. E., Kim, E., & Lake, C. (2017). Effective secondary science programs: A best‐evidence synthesis. Journal of Research in Science Teaching, 54(1), 58-81.
- Funder, D. C., & Ozer, D. J. (2019). Evaluating effect size in psychological research: Sin and nonsense. Advances in methods and practices in psychological science, 2(2), 156-168.
- Garcia Grau, F., Valls, C., Piqué, N., & Ruiz-Martín, H. (2021). The long-term effects of introducing the 5E model of instruction on students’ conceptual learning. International Journal of Science Education, 43(9), 1441-1458.
- Roblin, N. P., Schunn, C., & McKenney, S. (2018). What are critical features of science curriculum materials that impact student and teacher outcomes? Science education, 102(2), 260-282.


Leave a Reply